
- Decentralized Optimal DER Scheduling able to model active, DER-rich subsystems
- Explicit modeling of DERs services transacted in the market, and their exchange
- Locational and time-vector pricing of active/reactive power, and ancillary services
- Modeling, analytics, and valuation of DER services, market rules and business models
- Simulation of the DSO interactions with up-stream ISO, same-level DSOs, and downstream (microgrid, building, and home) prosumer subsystems.
- Co-simulation of grid physics, market layer and system controls layers under high DER deployment
- Advanced Interactive Visualization
- Cloud-based tool deployment
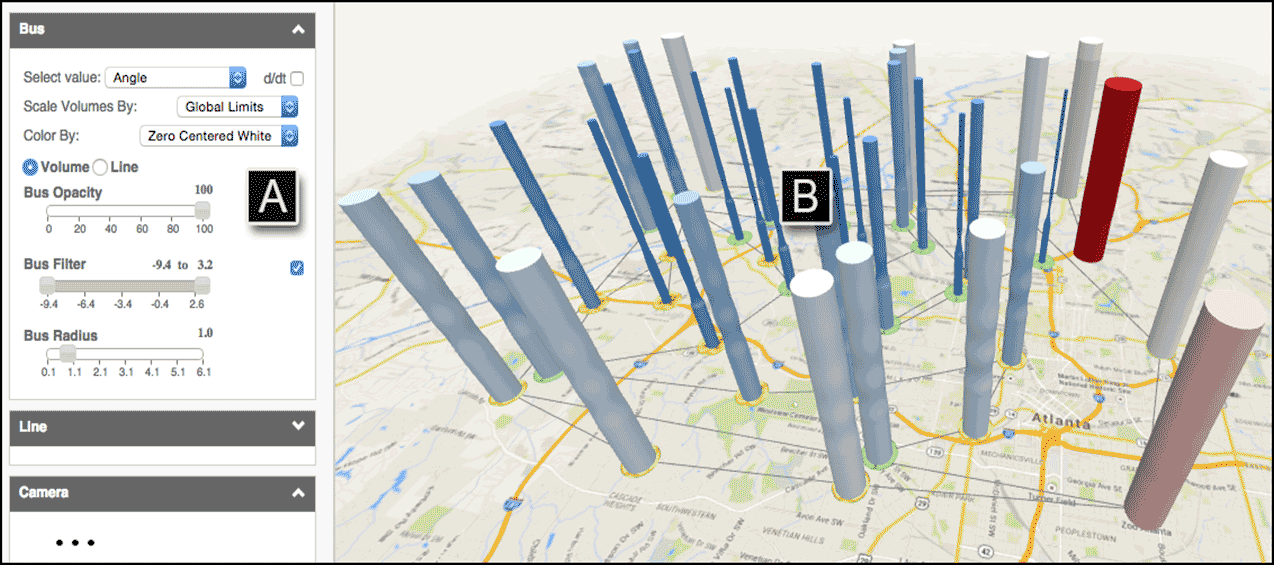
Space-time visualization. Vertical axis is used for time variation of quantities, with various options such as volume or plot.
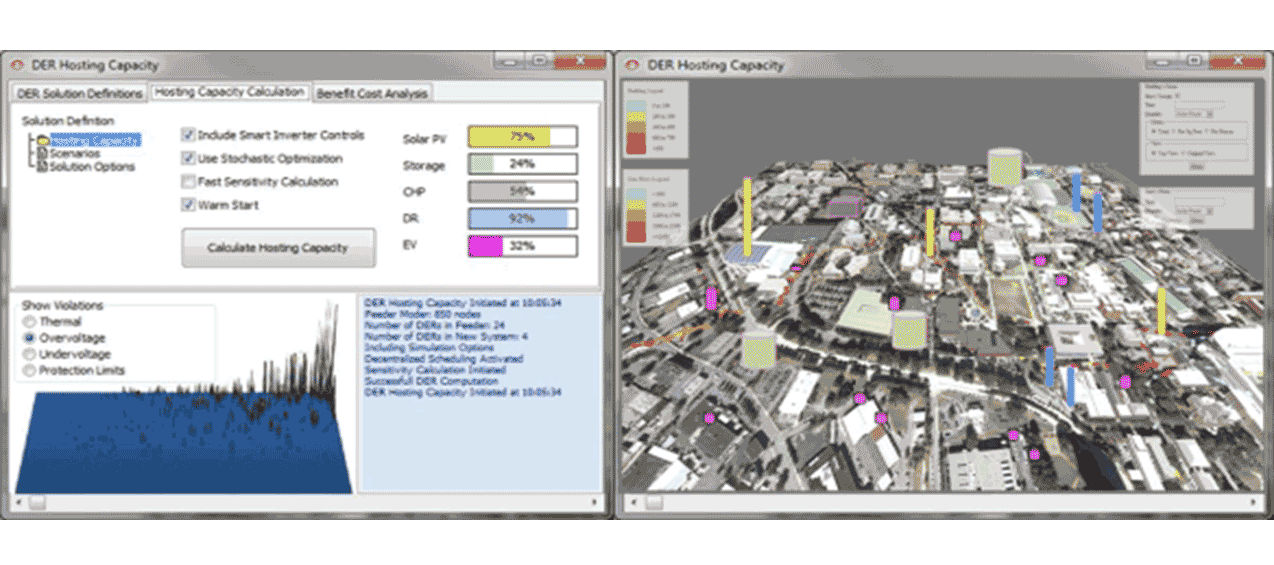
Illustration of System User Interface